


The Power of Visuals: How four companies effectively used visual content and three tools to get you started
An image is a powerful tool in the digital world.
It can draw attention, communicate value, increase shareability and so much more. In fact, HubSpot pulled together the “17 Stats You Should Know About Visual Content Marketing in 2015” to display this. From what your peers are doing to how effective visual content is for social sharing, the stats of recent studies are certainly interesting.
Two stats stuck out to me while researching this topic.
First, tweets with images were clicked 18% more and retweeted 150% more than those without, according to Buffer.
Second, when looking at the most shared posts from Facebook pages, a photo post made up 87% of interactions.
Even better than stats, I came across four success stories that show how visual content can greatly impact your content and social media marketing efforts, from blog views to Facebook shares.
Case study examples
As a smaller insurance company, HCC Medical Insurance Service (HCCMIS) needed a way to stand out in its marketplace. While insurance can typically be thought of as a boring product, the HCCMIS team decided to make their blog content more exciting with interactive infographics.
The result? The team saw a 1,000% lift in blog traffic, as well as significant lifts in social media followers and email revenue.
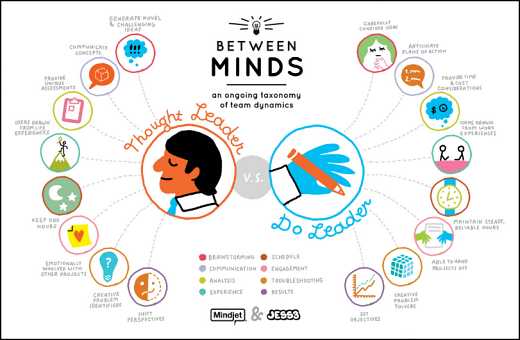
Content Marketing: Mindjet’s infographic strategy boosts blog traffic 420%, Facebook views 313.4%
Infographics don’t have to be just for consumer marketing. Mindjet, a collaborative work management software company, has developed a content strategy strongly rooted in infographics.
Parker Trewin, Director of Global Communications, Mindjet, said, “These infographics are perfect for us because they are very visual and serve as a visual complement to our product which is very visual in nature.”
While a good blog post before the new strategy would receive 700-1,000 views, the first infographic received 13,127 unique page views. With the new strategy in place, the blog has seen an increase of 420% in monthly unique page views.
Social Media Marketing: How New York Public Library increased card sign-ups by 35%
September marks National Library Card Sign-up Month and, for the New York Public Library, quotes have become a social media hit.
However, a simple copy and paste into a status update isn’t all that shareworthy.
The marketing team used postcard-like graphics to promote the library-related quotes and the library membership.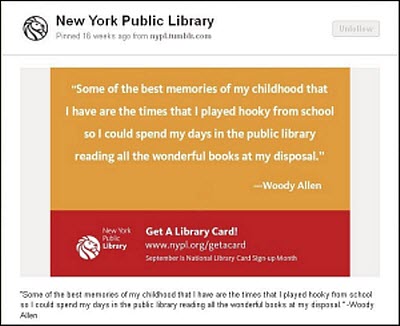
The simple but mighty images worked.
“It was crazy how much this little network generated; so Facebook averaged 722 interactions per post. That is about 500 more than the average,” Johannes Neuer, Director of Customer Experience, New York Public Library, said.
More importantly, library card sign-ups were 21% higher than the previous September.
This example goes a little differently than the previous ones. Instead of focusing on creating new graphics or pictures to share with their audience, Owaves had its users do the image posting to social media.
 The wellness planning app wanted to gain visibility for the launch of the latest version of its app. Being a very visual app, the team created a visual contest to encourage downloads and usage. The contest ran on Facebook, Twitter and Instagram.
By getting users to share their interaction with the app visually and pulling in key influencers, the marketers at Owaves were able to increase daily downloads by 100% and develop engaging content for and with customers.
I think this case study is a powerful lesson in that you don’t have to be the one posting images or graphics to see great results.
The tools
Now that your creative juices are flowing, here are three tools that you may have access to already that are free or low-cost.
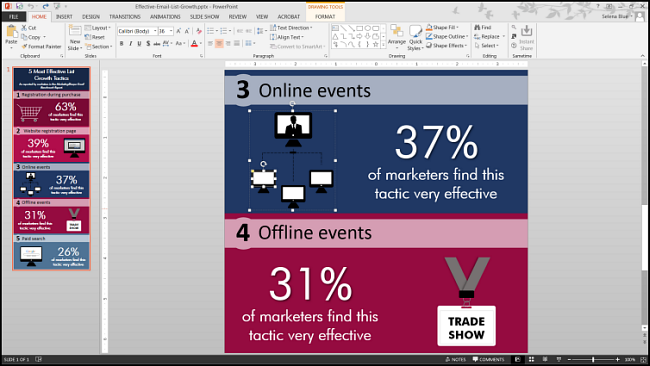
It’s a presentation software, I know. But if you thought it could only pump out decks, you’ve been missing out. PowerPoint can also be your best friend when making graphics. I’ve really loved it for making infographics and visual checklists. I’ve seen some stunning social media banners created in the software too.
You can simply change the dimensions of the slide for whatever project you want to work on. Not sure where to start? A simple Google search will provide templates, tutorials and ideas.
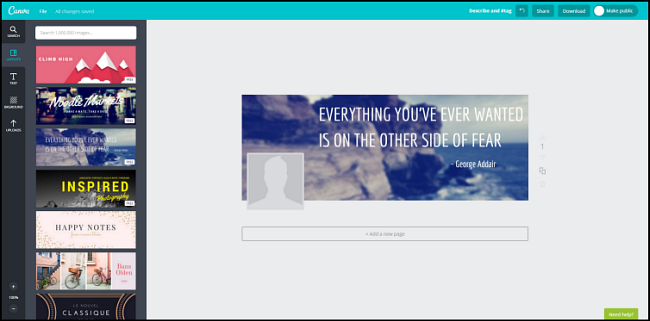
Here’s another office favorite. Canva is a free, online graphic design tool. Users start by picking the type of design they wish to make, from Facebook cover images and infographics, to business cards and posters. Based on the selection, the required or most common image dimensions are provided in the drag-and-drop tool.
The site provides hundreds of free photos, fonts and graphics, and has a bigger library of premium images and templates for small fees.
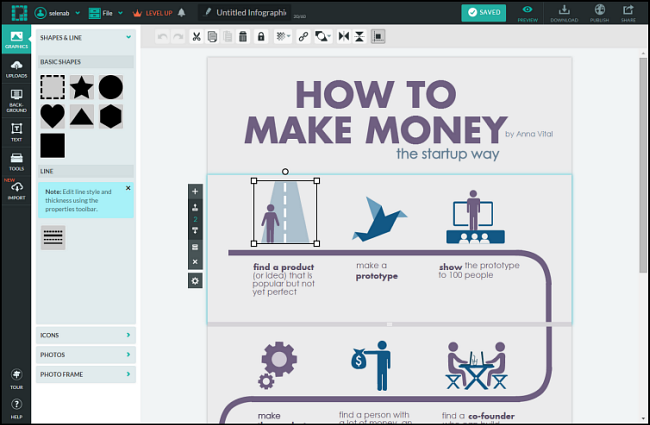
If infographics are what you want to explore, Piktochart is designed especially for infographic creation. The editor is free, and you can download your infographics as either PNGs or JPEGs in smaller resolution sizes and with a Piktochart watermark. The program has two levels of pricing that gets you more templates, PDF capabilities and no watermark required.
The site also provides a tour to get your feet off the ground and shows how to use the most common features.
You can follow Selena Blue, Manager of Editorial Content, MECLABS Institute on Twitter at @SelenaLBlue.
You might also like
MarketingSherpa Summit 2016 — At the Bellagio in Las Vegas, February 22-24
Landing Page Optimization (Online training course from MECLABS, MarketingSherpa’s parent research organization)
How to Redesign Your Site’s Images to Attract Relevant Prospects (From MarketingSherpa)
Marketing Research Chart: How do you know the most effective layout and images for your marketing sends? (From MarketingSherpa)
Categories: Consumer Marketing content marketing, Inbound Marketing, social media marketing, visual content, visual storytelling


I am also in field of SEO. Your post made it clear how images (info-graphics) can help businesses to grow.