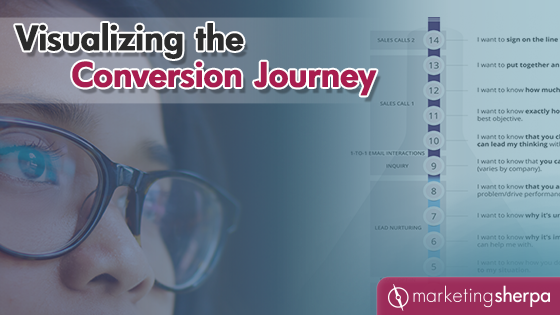
Visualizing the Conversion Journey
Here is the great struggle in all human relationships.
Me with my wife. Your brand with your customer. Even me with you, dear reader.
I am not you.
I am not my wife. You are not your customer.
However, we tend to think other people are like us. This is known as false consensus effect. Overcoming this cognitive bias – and striving to break down this barrier – is key to successful human relationships.
And thus, it is key to successful marketing. The better you understand how to truly serve your customers, the more successful your marketing will be.
Here’s one way to break down the barriers between your marketing team and your customers.
This article was originally published in the MarketingSherpa email newsletter.
A purchase is a journey
“Why do you insist on visualizing the conversion journey?” This question came from an attendee of a group coaching session with Flint McGlaughlin about conducting a data pattern analysis.
Visualizing the conversion journey is one way to break down that artificial barrier between you and the customer.
If marketers work on a landing page, direct mail piece or print ad in isolation, they overlook the real way potential customers make decisions in the real world.
Other than an impulse purchase, there is usually a step before. Or after. Or both. Or several steps. These other elements of the customer journey affect the overall success rate of whatever piece of marketing collateral your team is currently working on.
Here’s a simple example. MVMT used to send emails that linked to a general collection of its watches. When the team changed its strategy to use the emails to drive potential customers to specific landing pages that tied tightly to the campaign in the emails, they increased conversion 44% (see more in How the World’s Fastest-growing Watch Brand Used Email to Grow Revenue 98%).
To get you thinking of ways to visualize your customers’ conversion journey for your marketing team, here are a few tips.
Don’t view data in isolation
In the free Simplified MECLABS Institute Data Pattern Analysis Tool, there is a place to add in the metrics for a funnel analysis. Of course. (MECLABS is the parent organization of MarketingSherpa)
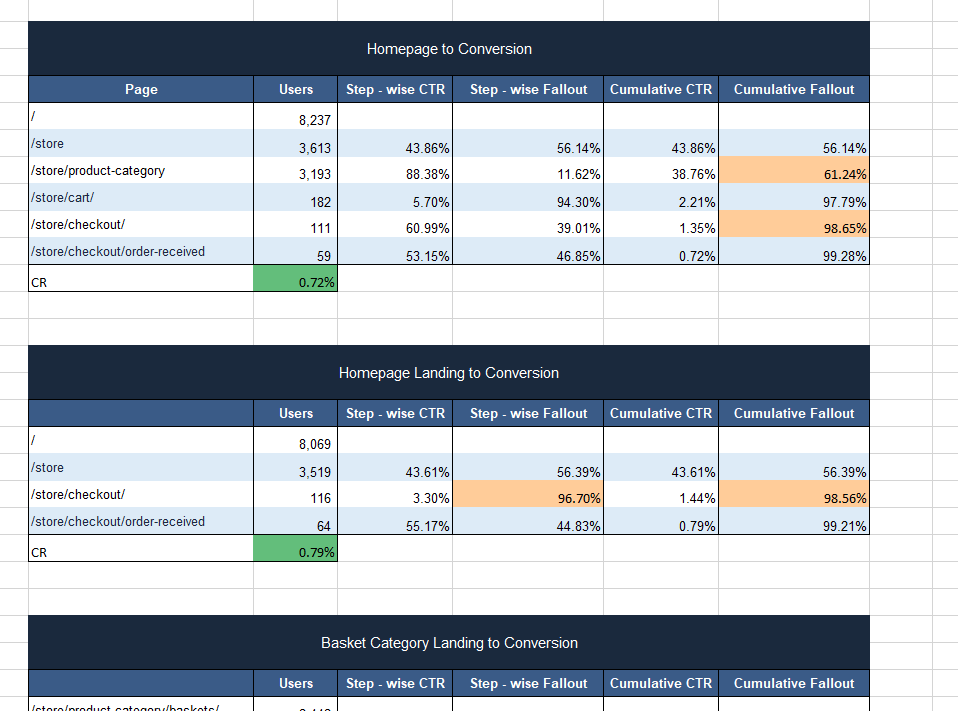
However, just seeing webpage paths and conversion numbers is not the best way to try to get into the customer’s shoes. The customer does not experience the conversion journey like this.
So there is also a place in the tool to add in the actual screenshots of the funnel.
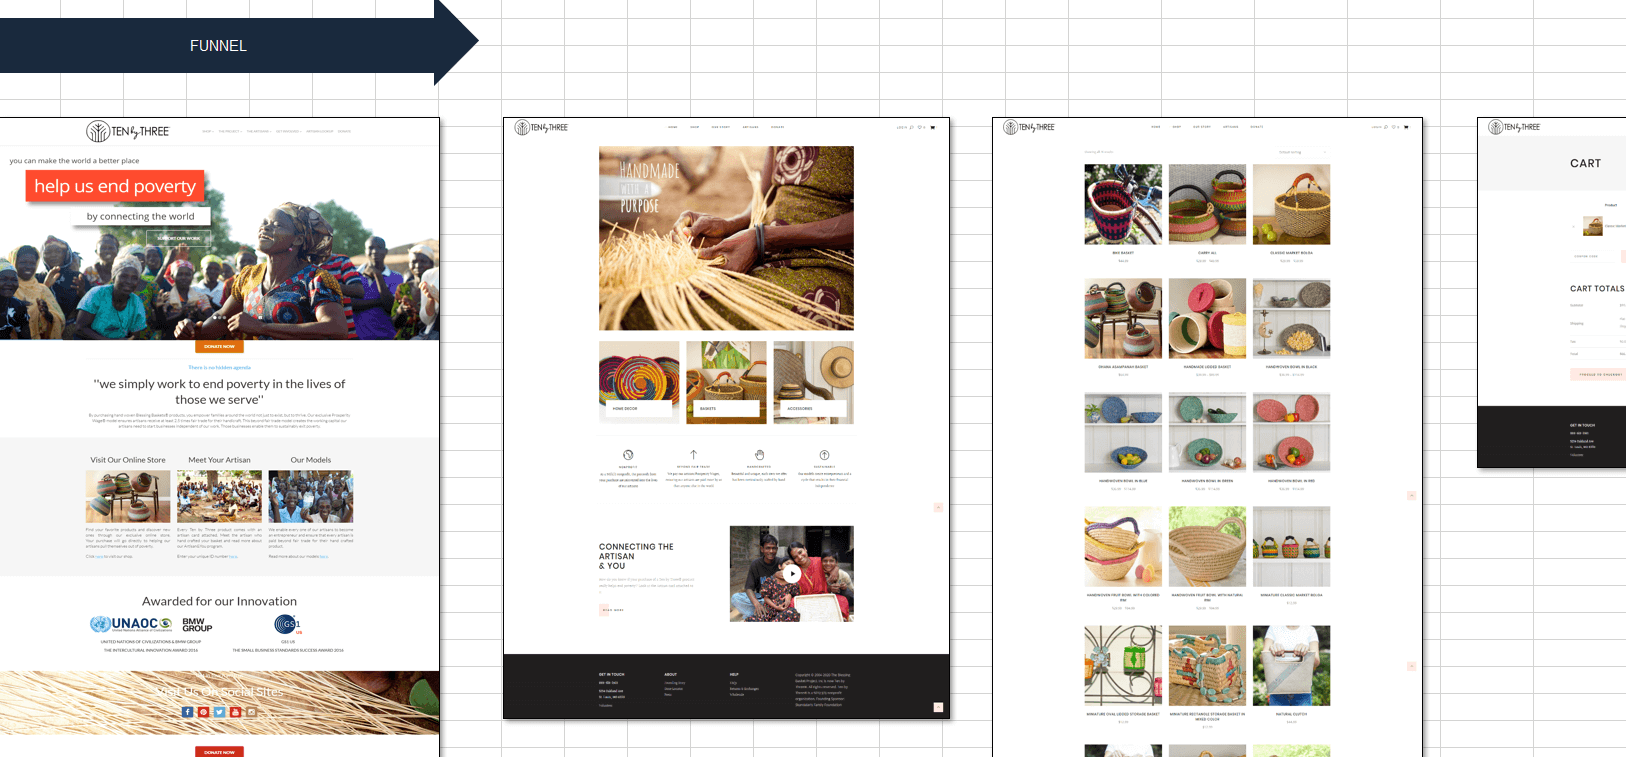
When using the tool, having the actual customer experience close at hand is a good reminder that conversion optimization is more than a numbers game. There are real people on the other sides of those numbers.
What does the world look like to them? The more you use data as a means to an end – to get closer to the human experience – the more you can leverage empathy in your marketing and increase conversion.
Immerse yourself in the customer experience
Many decisions that impact the customer are made in a meeting in a boardroom. The walls in that meeting room might be filled with generic art or company mission statements.
As a temporary way to bring the customer journey into that meeting – and set the right environment for your team to make customer-first decisions – print out each step of the customer journey and hang it on the walls of the meeting room as an oversize poster.
That’s what we do in a MECLABS Quick Win Intensive. Here’s an example:
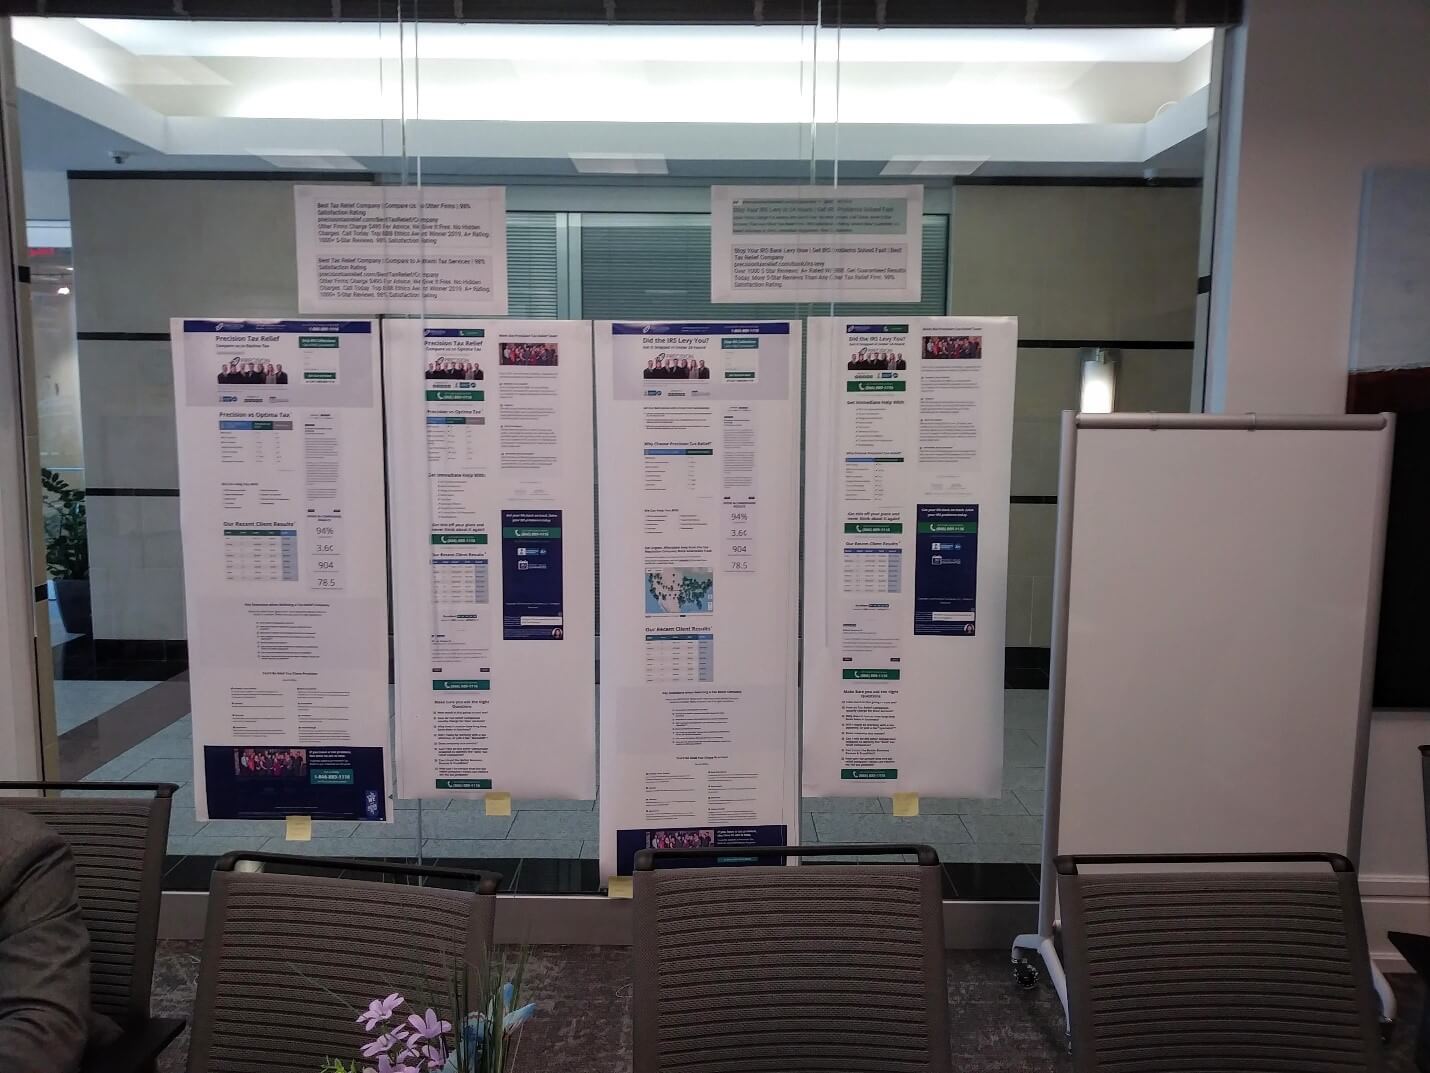
We’ll even use markers or Post-It notes to write the metrics right on each step of the conversion journey, or mark each step with potential conversion optimization changes.
This approach makes sure the changes aren’t made in isolation, and the entire customer journey is front and center. Should you change a certain headline or call to action? Well, when you see what customers are experiencing in the previous or next steps, you get a better sense if the entire journey is smooth and seamless.
Here’s an example of a more permanent way to visualize the conversion journey. In the MECLABS building, we had a Customer Experience Lab. There were a series of screens where you could pull up each step of the customer journey, in addition to magnetic boards if you wanted to include any print collateral and write on it. So as potential ideas are debated, the entire customer conversion journey is laid out clearly for everyone to see.

Of course, times have changed. Many people reading this article right now are not in offices or physical meeting rooms yet.
You can do a virtual version of the conversion journey over Zoom. Or print out the steps and hang them up in your home office. The core goal is the same whether you’re working in-person or remote – making sure you and your team can’t overlook the customer journey when making key decisions.
Map out the big picture
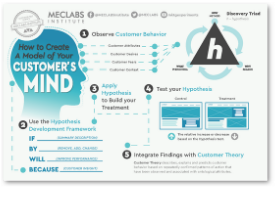
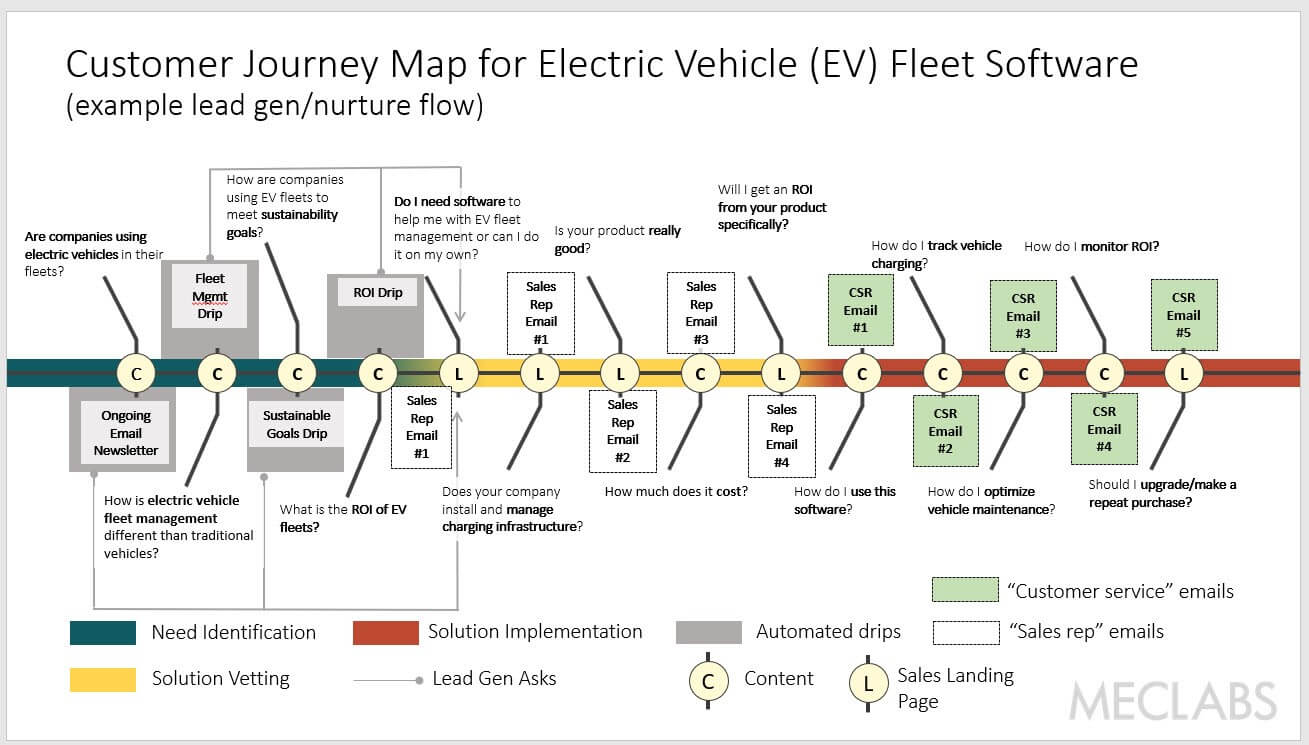
Visualizing the conversion journey isn’t just about seeing what the customer sees, you should also try to think what the customer thinks. For example, you could create a customer journey map clearly showing the questions potential customers have as they consider your product and map the marketing and sales material and interactions you are using to address these questions.
Or you can approach the customer journey from the opposite direction. Instead of focusing on the questions potential customers have about your product, identify the key conclusions they need to reach to keep traveling along the journey with your company that ultimately leads to a product purchase by creating a prospect conclusion funnel.

As you can see, there’s more than one way to visualize the customer conversion journey. The exact way you go about is less important than the intent behind it – better understanding your customer to better serve the customer and improve results.
You can follow Daniel Burstein, Senior Director, Content & Marketing, MarketingSherpa and MECLABS Institute, on Twitter @DanielBurstein.
You might also like…
Data Pattern Analysis: Learn from a coaching session with Flint McGlaughlin